Important
You are browsing documentation for version 5.0 of OroCommerce. Support of this version ended in January 2025. Read the documentation for version 6.1 (the latest LTS version) to get up-to-date information.
See our Release Process documentation for more information on the currently supported and upcoming releases.
Use Custom Reports
Create a Custom Report
To create a custom report:
Navigate to Reports and Segments > Manage Custom Reports in the main menu.
Click Create Report at the top right of the page.
On the Create Report page, define the report’s properties, as described in the sections below.
General

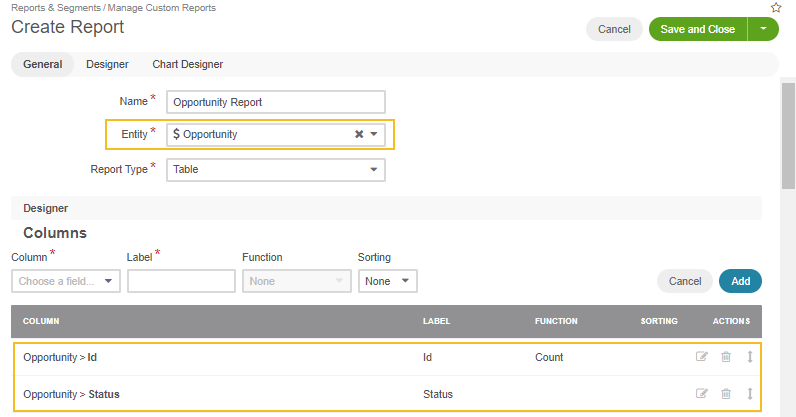
The following fields are mandatory, and must be defined for a report:
Field |
Description |
|---|---|
Name |
A name that is used to refer to the report on the interface. It is recommended to create a name that indicates the information the report presents. |
Entity |
A target entity of the report. Its data will be used to generate the report. Select one of the entities from the list. (You can also start typing the entity name in the text field to narrow down your entity choices). |
Report Type |
Select Table from the list. The report will present the data in the form of a table. Currently, this is the only available type. |
Owner |
Select the user who can manage this report and be responsible for it. |
The only optional system field is Description. It can be used to save additional information about the report.
Designer
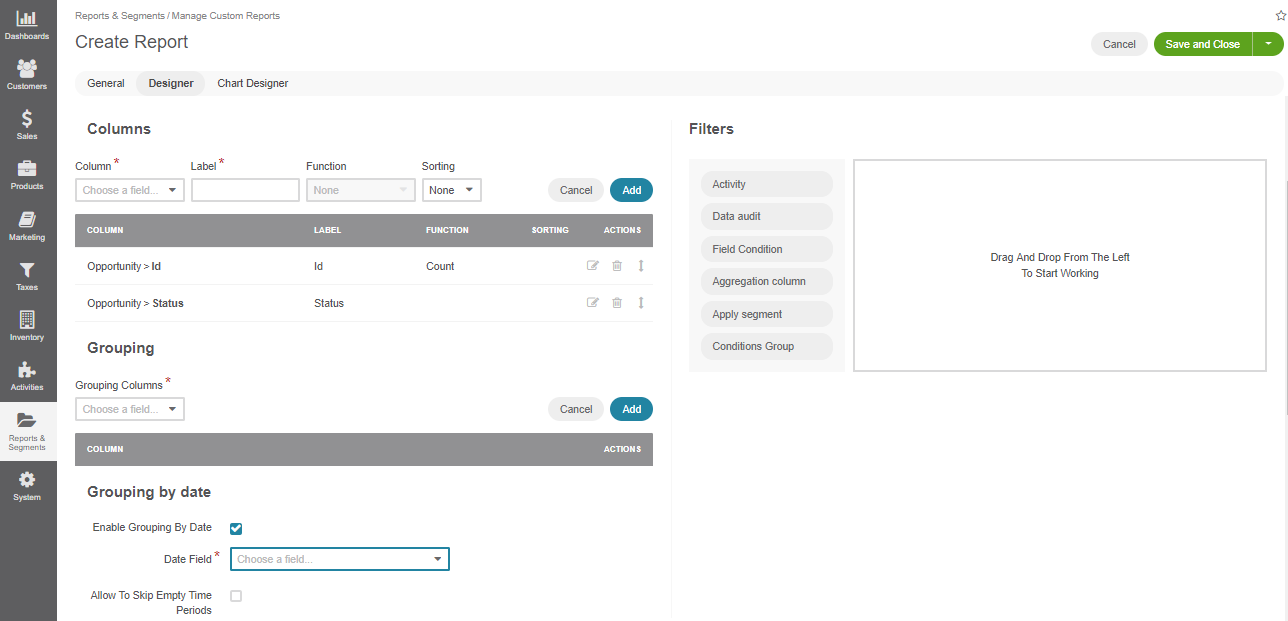
In the Designer section, you can define the structure of your report.

Four main subsections help you build your report:
Columns—Define which columns your report will contain.
Grouping—Define how the information in your report will be aggregated.
Grouping by Date—Enable period filters.
Filters—Apply filters to your report’s data to select only the necessary information.
Columns
Add a Column
To add a column:
Specify the required data:
Click Add.
The field you have defined will appear in the COLUMN table.
Edit a Column
To edit a column:
Click the Edit icon to the right of the corresponding row.
Perform the required changes as described in the Add a Column section description.
Click Save.
Delete a Column
To delete a column:
Click the Delete icon to the right of the corresponding row.
In the Delete Confirmation dialog box, click Yes, Delete.
Rearrange Report Columns
To move a column, click the Move icon to the right of the corresponding row, hold the mouse button, and drag the column up (to make it appear earlier in the report) or down (to make it appear later).
Grouping
When you specify a function for some of the fields, you must add all other fields (that do not have any function specified for them) to the Grouping section.
Add a Field to Grouping
To add a field to the Grouping section, select it from the Grouping Columns field, and click Add. For example, you can see a total, average, maximum, and minimum budget amount for each opportunity with the same status.
Warning
Do not add fields that are not present in the Columns section.
Remove a Field from Grouping
To remove a field from the Grouping section:
Click the Delete icon to the right of the corresponding row.
In the Delete Confirmation dialog box, click Yes, Delete.
Grouping by Date
In this section, you can define whether to show additional period filters for this report on the report view page.

With these filters, you can define the date range to filter the report data and group the data in this range by periods (days, months, quarters, years). You can also decide whether to show or not the periods that do not contain any data.

Field |
Description |
|---|---|
Enable Grouping by Date |
Select this checkbox to enable additional date filters. |
Date Field |
Select the date field which will be used for grouping. Only the date fields related to the selected entity are available. |
Allow to Skip Empty Time Periods |
Select/deselect this checkbox to show/hide the periods that do not contain any data. |
Filters
You can define the conditions used to select specific records. Only the data of the records that meet all the conditions defined in the Filters section will be used for the report.
For more details, see the Filters guide.
Chart Designer

Chart
OroCommerce supports line charts. To create a line chart for the report, define the following fields (all the fields are mandatory) in the Chart section.
Field |
Description |
|---|---|
Chart Type |
Currently only the Line Chart option is available |
Category (X Axis) |
Select the fields with the values which will form the X Axis of the report chart. |
Value (Y Axis) |
Choose the fields with the values which will form the Y Axis of the report chart. |
For more details, see the chart example.
View a Custom Report
From the Custom Reports List
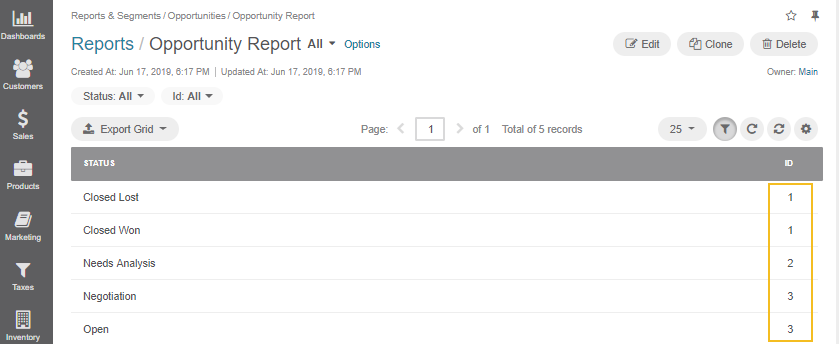
In the main menu, navigate to Reports & Segments > Manage Reports, and in the custom reports list, click the required report.
Alternatively, hover over the More Options menu and click the View icon.

From the Custom Report View Page
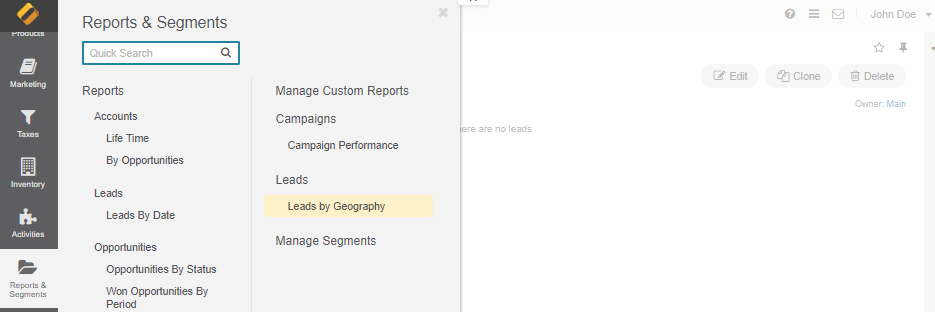
In the main menu, navigate to Reports & Segments. Custom reports are gathered in sections by the name of the field they are related to. Select the required section, navigate to the desired report, and click it.

Export a Report
Note
Please be aware the Export Grid button may not be available for some reports if the grid you want to export contains grouping by a related entity.
Open the report that you want to export:
To export a custom report, navigate to Reports & Segments > Manage Reports in the main menu and click the required report.
To export a system report, navigate to Reports & Segments > Reports in the main menu and further to the required report (e.g. Reports & Segments > Reports > Accounts > Life Time).
On the report page, click the Export Grid button in the upper-left corner and then click CSV or XLSX to export the report to the file of the corresponding format.

Edit a Custom Report
From the Custom Reports Grid
In the main menu, navigate to Reports & Segments > Manage Reports.
On the All Reports page, hover over the More Options menu, and then click the Edit icon.

Update the report details as required. For the description of the fields, see Create a Custom Report.
Click Save.
From the Custom Report View Page
In the main menu, navigate to Reports & Segments > Manage Reports.
On the All Reports page, click the required report.
Alternatively, hover over the More Options menu, and then click the View icon.
On the report page, click Edit in the upper-right corner.
Update the report details as required. For the description of the fields, see Create a Custom Report.
Click Save.
Delete a Custom Report
From the Custom Reports Grid
In the main menu, navigate to Reports & Segments > Manage Reports.
On the custom reports page, select the report to delete, hover over the More Options menu, and then click Delete.
In the Deletion Confirmation dialog box, click Yes, Delete.
From the Custom Report View Page
Alternatively, you can delete a custom report from the reports view page by clicking Delete in the upper-right corner.

Delete Multiple Custom Reports
You can delete multiple custom reports at a time.
In the main menu, navigate to Reports & Segments > Manage Reports.
Select multiple custom reports by clicking in the left corner of the list header.
Hover over the More Options menu at the end of the list header and click to delete multiple reports simultaneously.

In the Delete Confirmation dialog box, click Yes, Delete.
Related Topics

