Important
You are browsing documentation for version 5.0 of OroCommerce, supported until January 2025. Read the documentation for version 6.0 (the latest LTS version) to get up-to-date information.
See our Release Process documentation for more information on the currently supported and upcoming releases.
Error Processing and Log Monitoring
Troubleshooting performance issues is not always straightforward, as many things can affect application performance, but proper monitoring practice prevents bugs from heavily impacting your production. We, therefore, recommend using Google Cloud Platform Error Reporting and Logs Explorer tools to identify slow application requests, analyze the root cause of the issues, and set up notifications for potential errors. These tools can help you build a powerful error-processing flow to keep quality standards high and minimize the number of errors that may slip into your production environment.
Error Handling
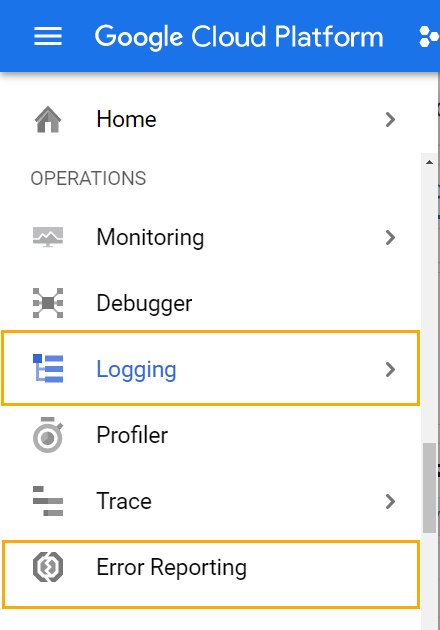
Google Cloud’s Error Reporting enables you to identify and understand your application errors by aggregating and displaying errors produced in your running cloud services.
Review the list below to learn what helpful error reporting features are available for monitoring your application:
-
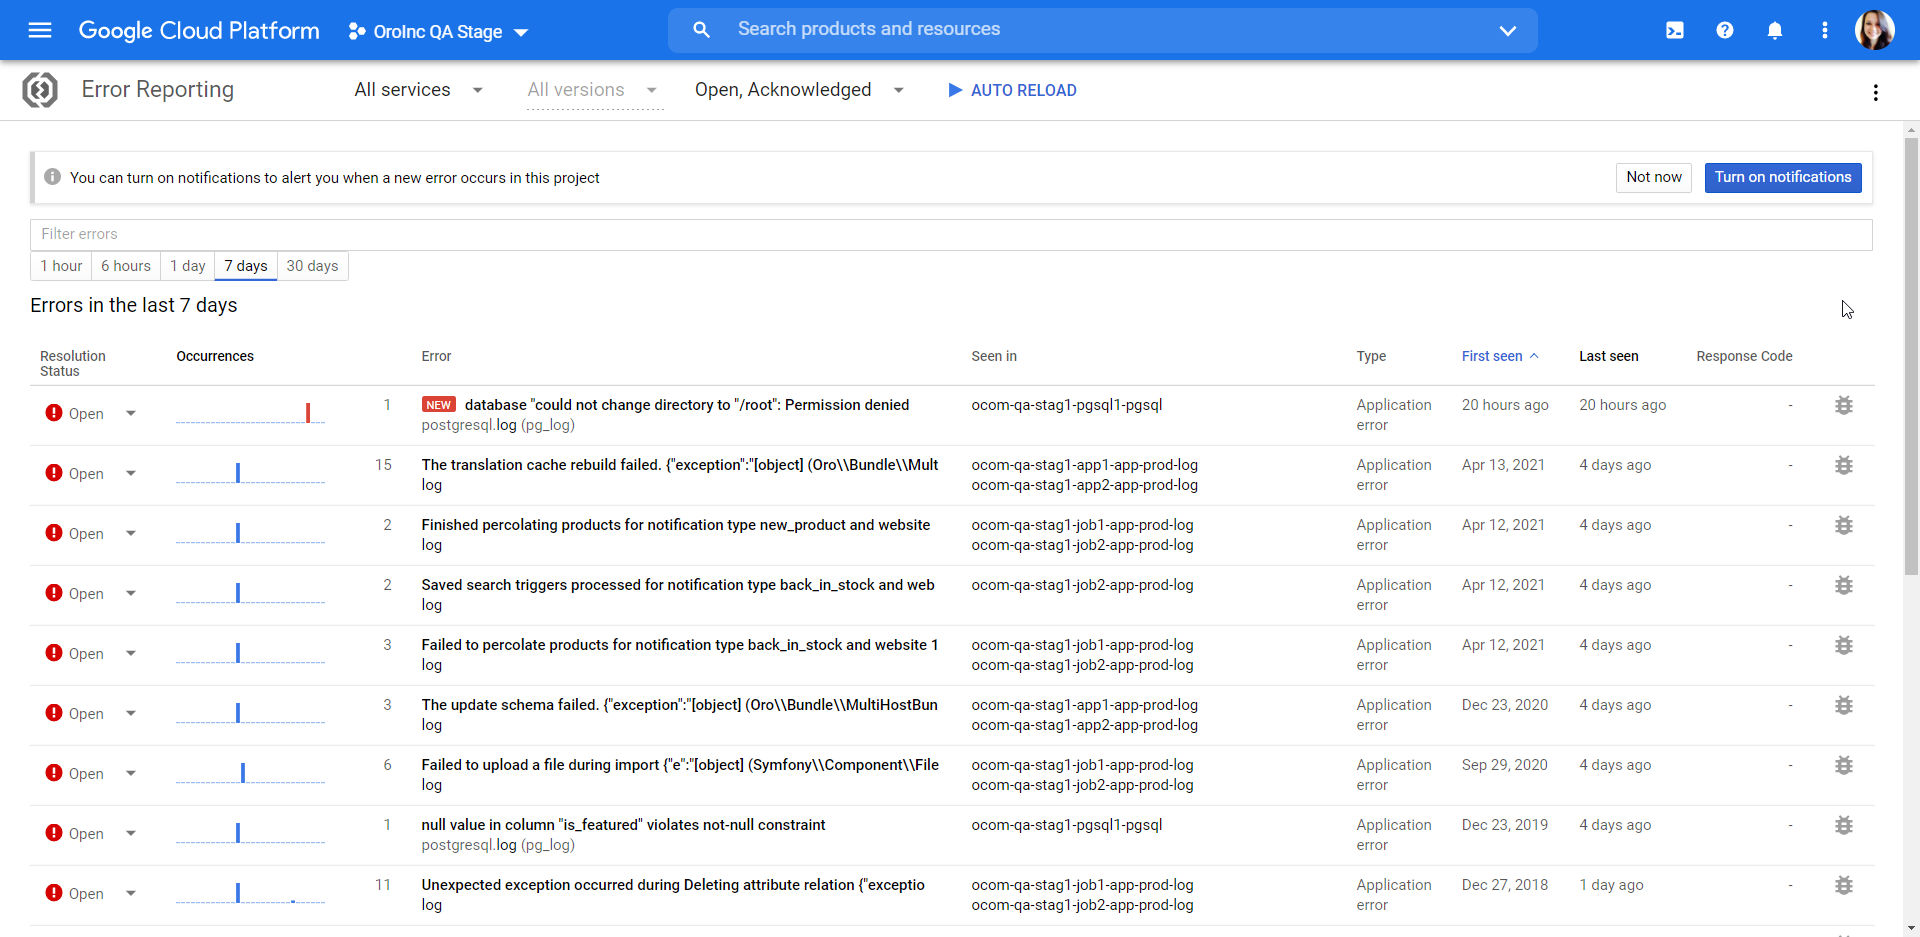
You can view your errors on the Error Reporting page of your GCP Console, which displays a list of all errors in the order of frequency. Errors with the same root cause are grouped together. The error reporting list provides the following information for all reported errors:
Resolution status
Occurrences
Users
Error
Seen in
First seen
Last seen
Response code
For more information, refer to Viewing Errors and How Errors are Grouped documentation on Google’s website.
-
When monitoring errors in production, it is essential to know where and when the problem occurred in your instance. A good rule of thumb is to set up alerts to receive notifications when an error occurs in your project, or when errors become too frequent and exceed their normal limit.

-
You can manage all your errors and filter them by status. There are 4 error resolution statuses:
Open — The initial state of all error groups.
Acknowledged — Errors in this state are being processed to determine the line of action.
Resolved — When you resolve an error group, it is considered fixed and not expected to occur again. An error that was resolved but occurred again returns to the console in status Open.
Muted — Errors with status Muted do not appear in the error list.
-
You can link error groups to issues created to tackle them in a 3rd party application (e.g., Jira). Look out for the bug report icon next to the Response Column of each respective error group row in the list.
-
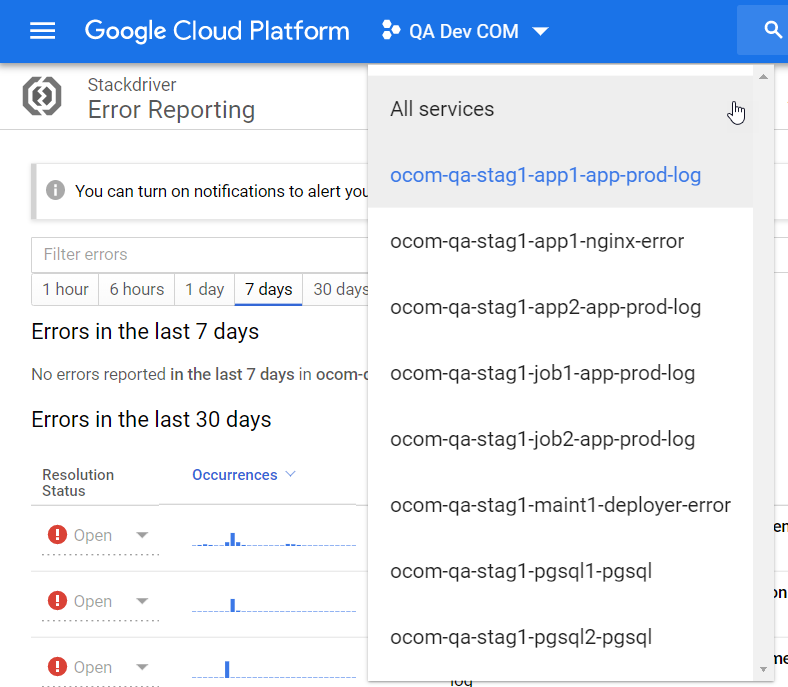
You can filter, sort, and restrict errors displayed in the error reporting list by using either text matching or filtering by resolution status.
For example, you can view errors from specific logs under All Services, as illustrated below:
Log Monitoring
Collecting and processing logs are essential when troubleshooting errors. OroCloud uses the Logs Explorer service to collect logs from all system components of the application environment, and all logs are available via the GCP console. Logs are grouped per host and type.
A number of logs are available from the GCP - standard component system logs, and application-specific. Application-specific logs are app prod and consumer; other logs are responsible for aggregating component-specific errors, like naxsi-error or nginx-error. However, understanding of the OroCloud deployment architecture is essential to work with the provided information efficiently.
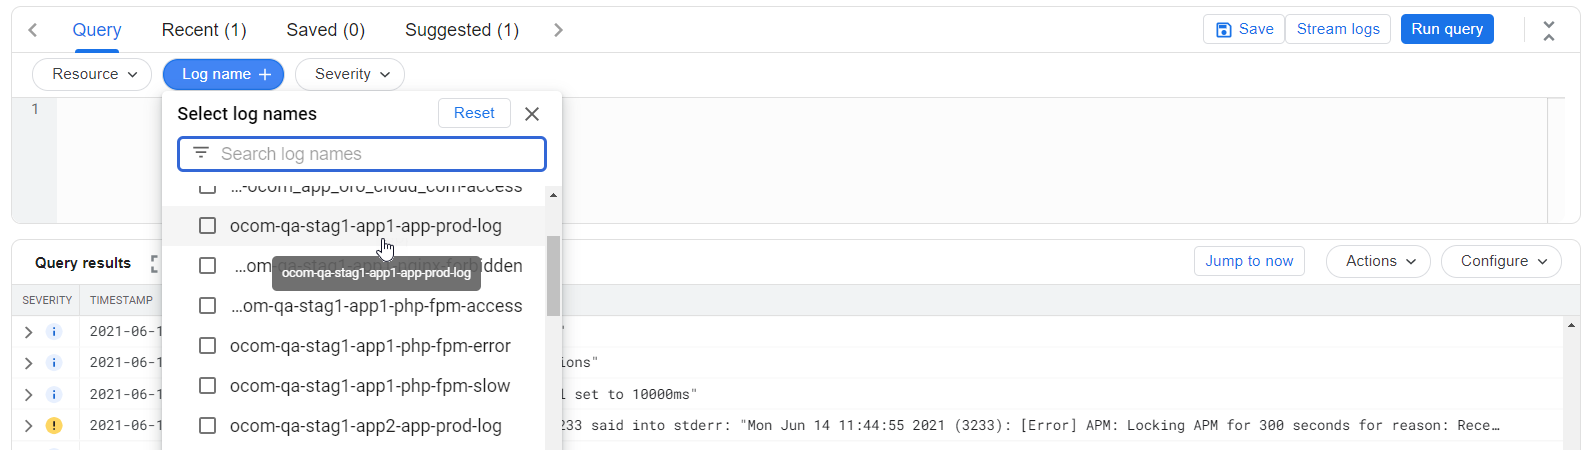
Working with Logs
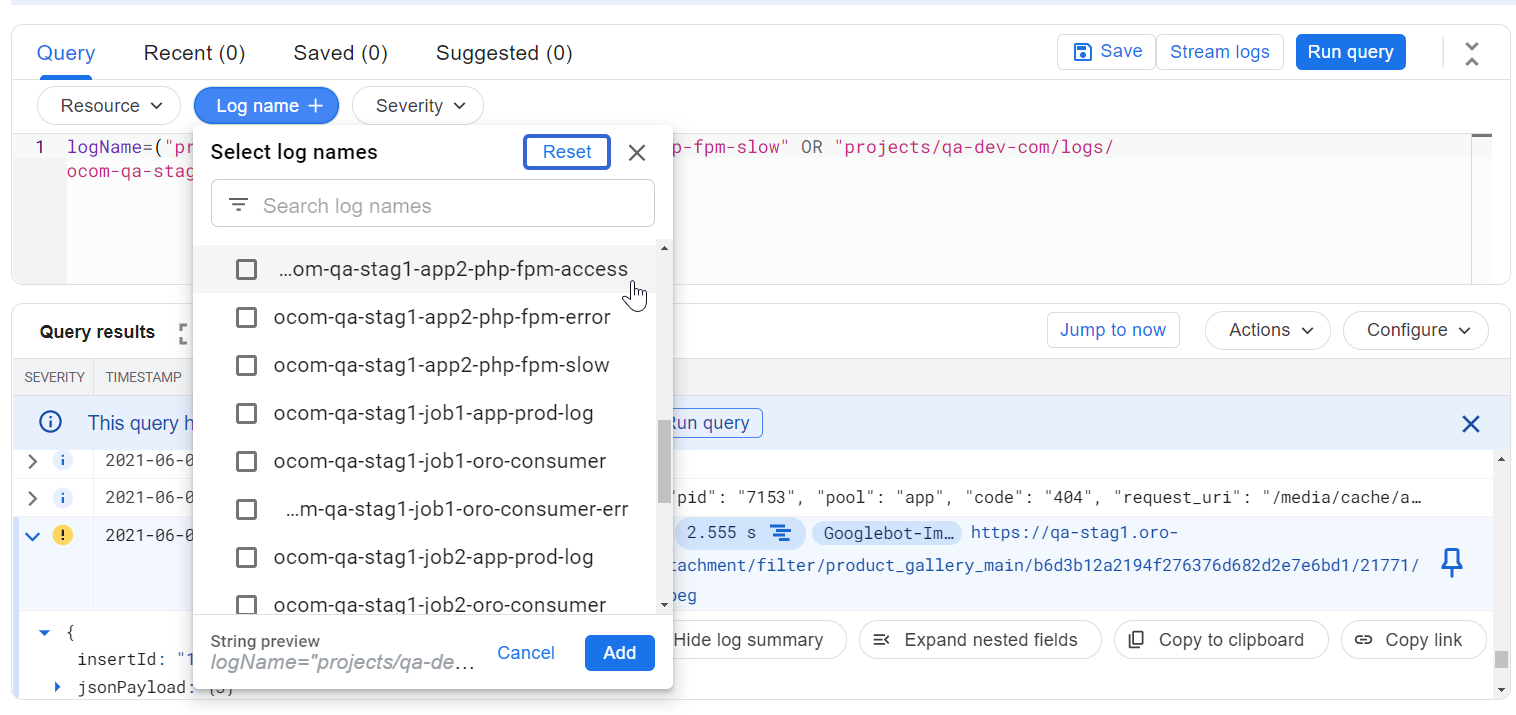
A typical setup has two application (app) hosts that handle all web traffic of the application. Use the host selector to choose a specific host:
Application hosts have php-fpm access logs and php-fpm slow logs configured. These types of logs enable us to identify slow requests and access the trace of the request. Request execution time (exectime), URI (request_uri) and process identifier (pid) are logged in php-fpm access logs. Al requests with execution time over 5 seconds are logged as warnings:
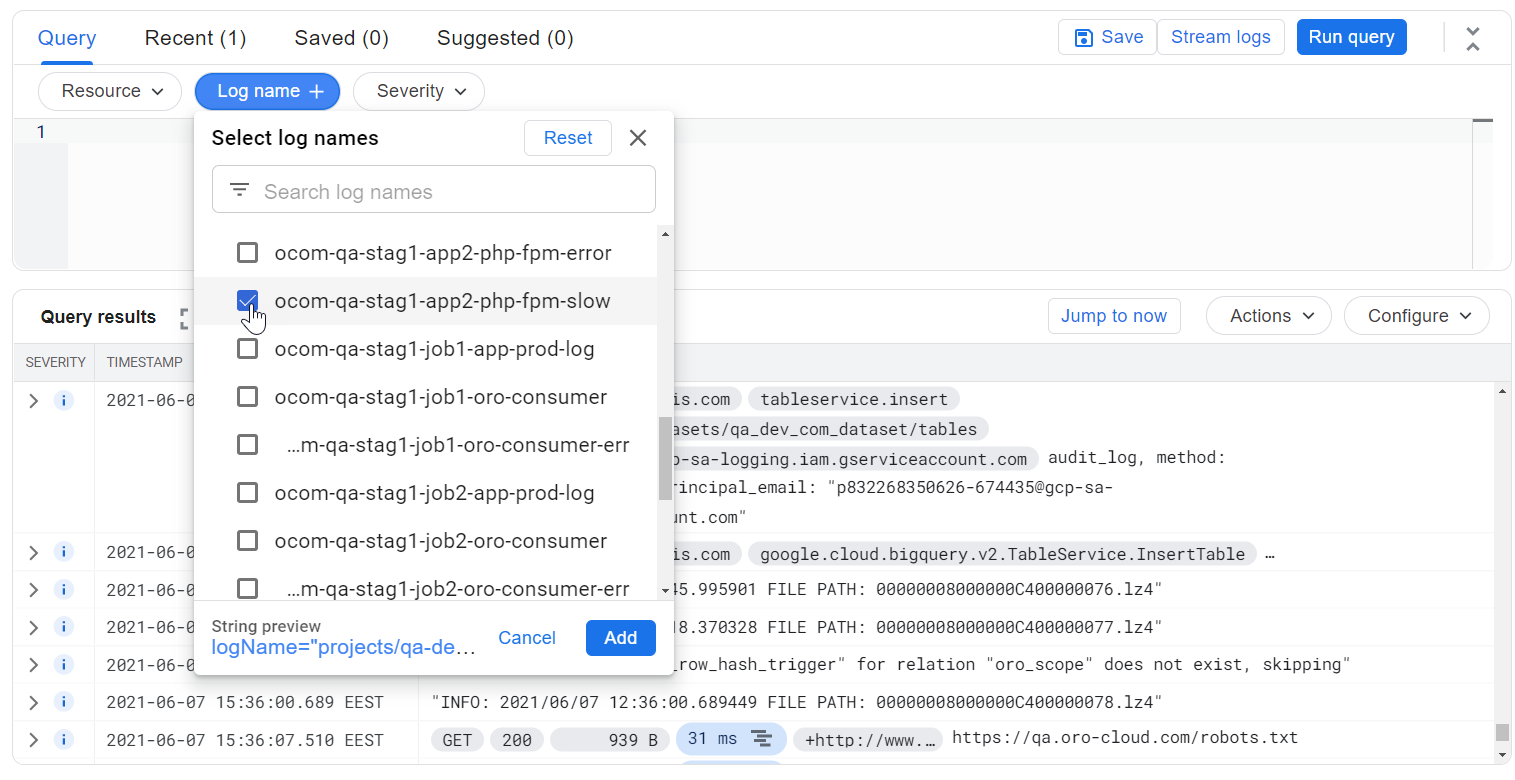
PID of the request can be used to find a trace in php-fpm slow logs and identify the root cause of slowness:
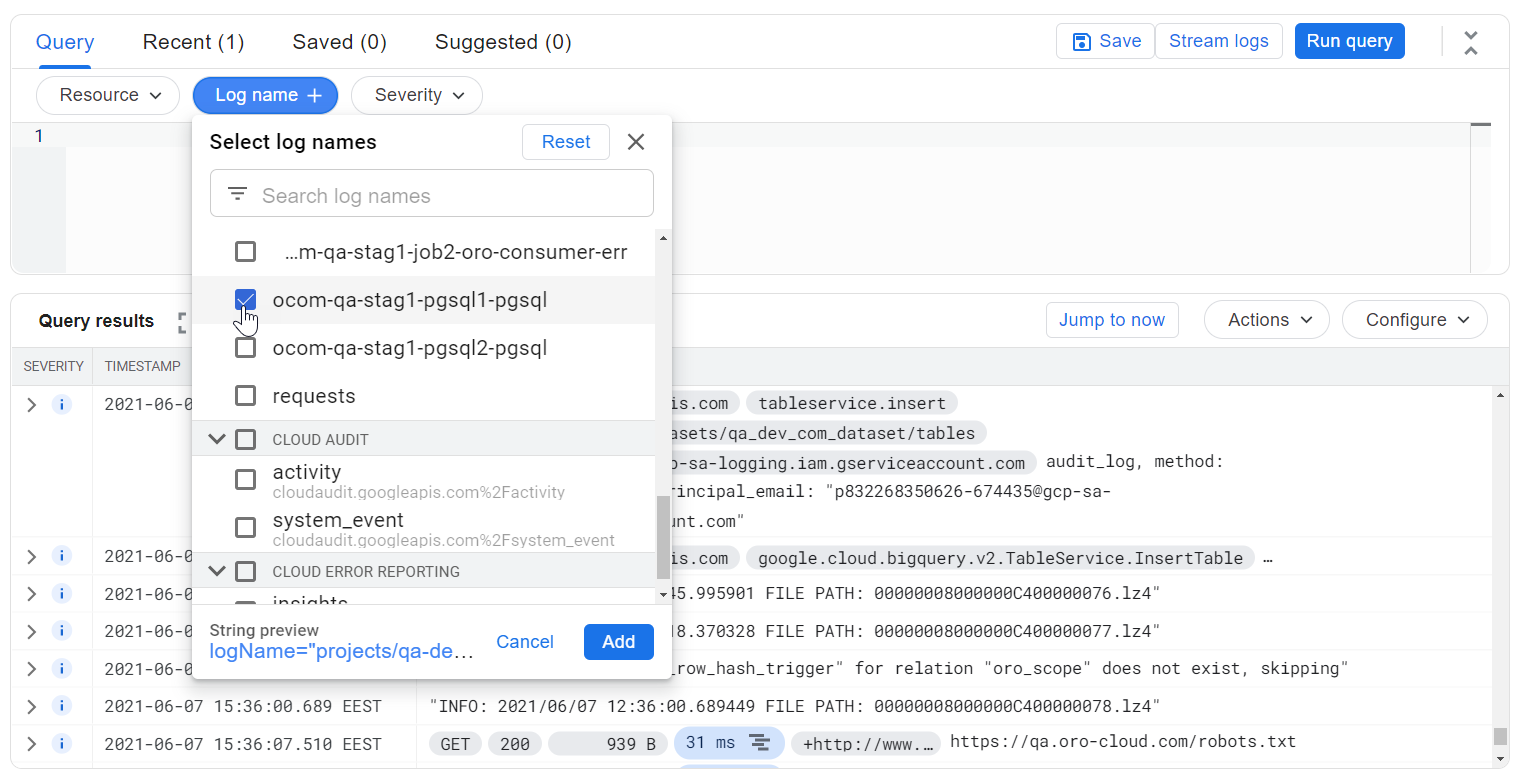
DB slow logs are part of PostgreSQL host logging and are available in pgsql host logs:
Hint
You can filter all logs by their source, level, time, and host.
For more information on logging, refer to Google’s Logs Explorer documentation.
Adding Fields to Log Summary Line
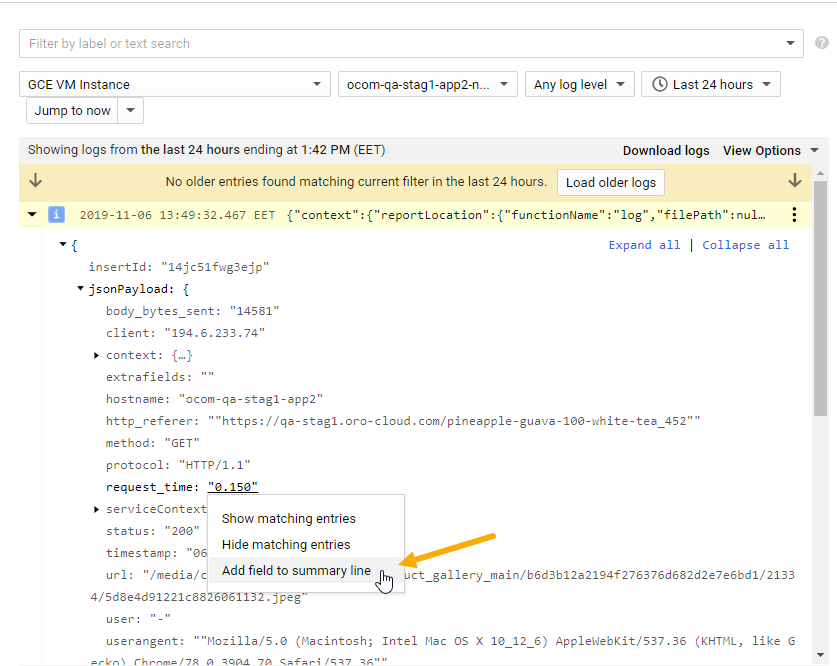
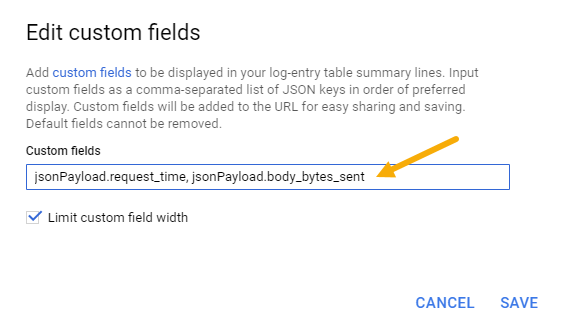
Log summary lines may contain a considerable amount of information but not all of it may be the information you look for most regularly. Adding custom fields to log summary lines enables you to see the necessary information highlighted in blue at the beginning of each line, whenever these fields are available for your log entries.
Below is an example of adding a request_time field to a log entry table summary lines. The Add field to summary line option is displayed once you click on the required field within the JSON representation in an expanded log entry.
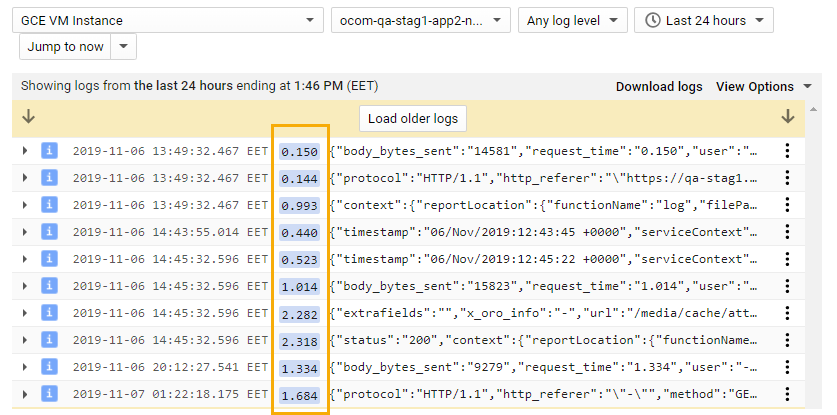
Once the field is added, it becomes available in the table:
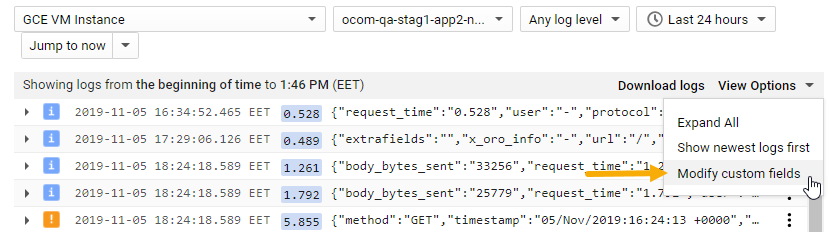
You can add as many custom fields as necessary, and also edit or remove them from the Viewing Options menu on the top right of the log viewer.
For more information on working with custom fields, refer to Google’s Custom Fields documentation.