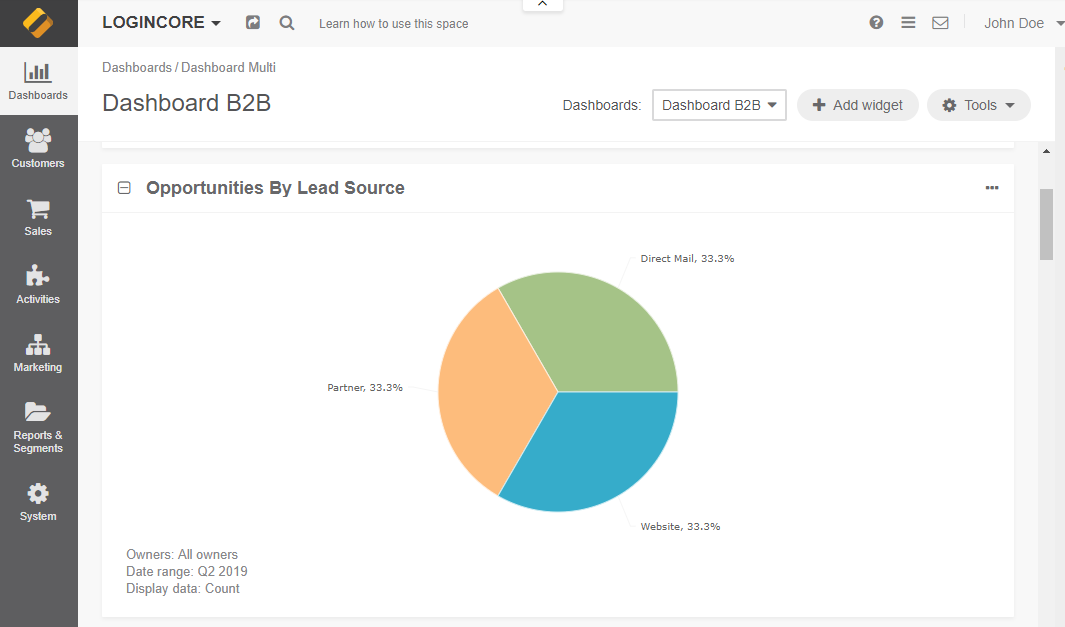
Opportunities by Lead Source
The Opportunities by Lead Source widget displays the breakdown of opportunities by lead sources in the form of a pie chart.
Note
For how to add widgets to the dashboard and manage them, see the relevant topics:
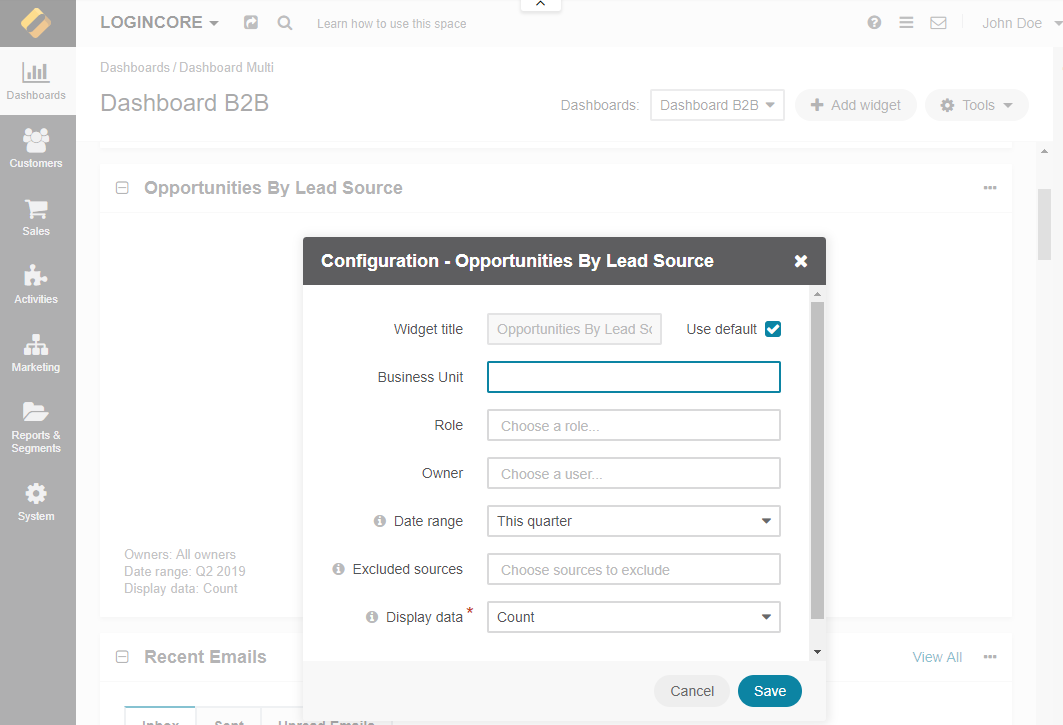
Opportunities by Lead Source Widget Configuration
You can adjust the following settings for the opportunities by lead source widget:
Widget title — the name displayed on the dashboard. To change the name, clear the Use Default checkbox and provide a new name.
Business unit — select the business unit to present statistics for.
Role — select the user’s role (e.g., a sales manager, an administrator, a leads development rep, etc.) to see statistics for.
Owner — select the owner for the widget to see statistics for a particular user.
Date Range — the time for which the widget details are displayed.
Excluded sources — select what opportunity status the widget should not display (e.g., Closed Won).
Display data — choose which data to display on the chart. The count shows the number of opportunities in a particular status, and amount displays their total budget.