Important
You are browsing the documentation for version 4.1 of OroCommerce, OroCRM and OroPlatform, which is no longer maintained. Read the latest LTS version of the Oro documentation to get up-to-date information.
See our Release Process documentation for more information on the currently supported and upcoming releases.
Writing Logs to ELK Stack
ELK Stack is the acronym that represents three open source projects: Elasticsearch, Logstash, and Kibana. Elasticsearch is a search and analytics engine. Logstash is a server‑side data processing pipeline that ingests data from multiple sources simultaneously, transforms it, and then sends it to a “stash” like Elasticsearch. Kibana lets users visualize data with charts and graphs in Elasticsearch.
Installing ELK Stack
See the documentation on how to install ELK Stack on Elastic website.
Using Logstash Formatter
Logstash supports a variety of inputs that pull in all events from a multitude of common sources simultaneously. For more detailed documentation, check the Logstash product page.
Configure Monolog Logstash formatter in your config_%env%.yml file.
# path/to/config_prod.yml

monolog:
   handlers:
       consumer:
           type:       stream
           path:       "%kernel.logs_dir%/consumer.log"
           level:      debug
           channel:    ["consumer"]
           formatter:  monolog.formatter.logstash
Logs will be formatted like:
{
 "@timestamp":" 2019-04-30T08:49:54.289986+03:00",
 "@source":"source",
 "@fields": {
     "channel":"consumer",
     "level":250,
     "processor":"Oro\\Component\\MessageQueue\\Router\\RouteRecipientListProcessor",
     "message_id":"oro.5cc7e18f1a6746.10499608",
     "message_body":"",
     "message_properties": {
          "oro.message_queue.client.topic_name":"oro.redirect.calculate_cache.mass",
          "oro.message_queue.client.processor_name":"oro_message_queue.client.route_message_processor",
          "oro.message_queue.client.queue_name":"oro.default"
     },
     "message_headers": {
         "content_type":"text/plain",
         "message_id":"oro.5cc7e18f1a6746.10499608",
         "timestamp":1556603279
     },
     "message_priority":2,
     "elapsed_time":"8 ms",
     "memory_usage":"54.02 MB",
     "peak_memory":"54.01 MB",
     "memory_taken":"151.43 KB",
     "ctxt_status":"ACK",
     "ctxt_time_taken":3
 },
 "@message":"Message processed: ACK. Execution time: 3 ms",
 "@tags": ["consumer"],
 "@type":"app"
}
Using Filebeat
Filebeat helps you keep the simple things simple by offering a lightweight way to forward and centralize logs and files. Filebeat comes with internal modules (auditd, Apache, NGINX, System, MySQL, and more) that simplify the collection, parsing, and visualization of common log formats down to a single command.
Filebeat configuration:
output.logstash
    enabled: true
    hosts: ["localhost:5044"]

filebeat.prospectors:
- type: log
    paths:
        - /path/to/the/application/var/logs/consumer*.log
    json:
        keys_under_root: true
        overwrite_keys: true
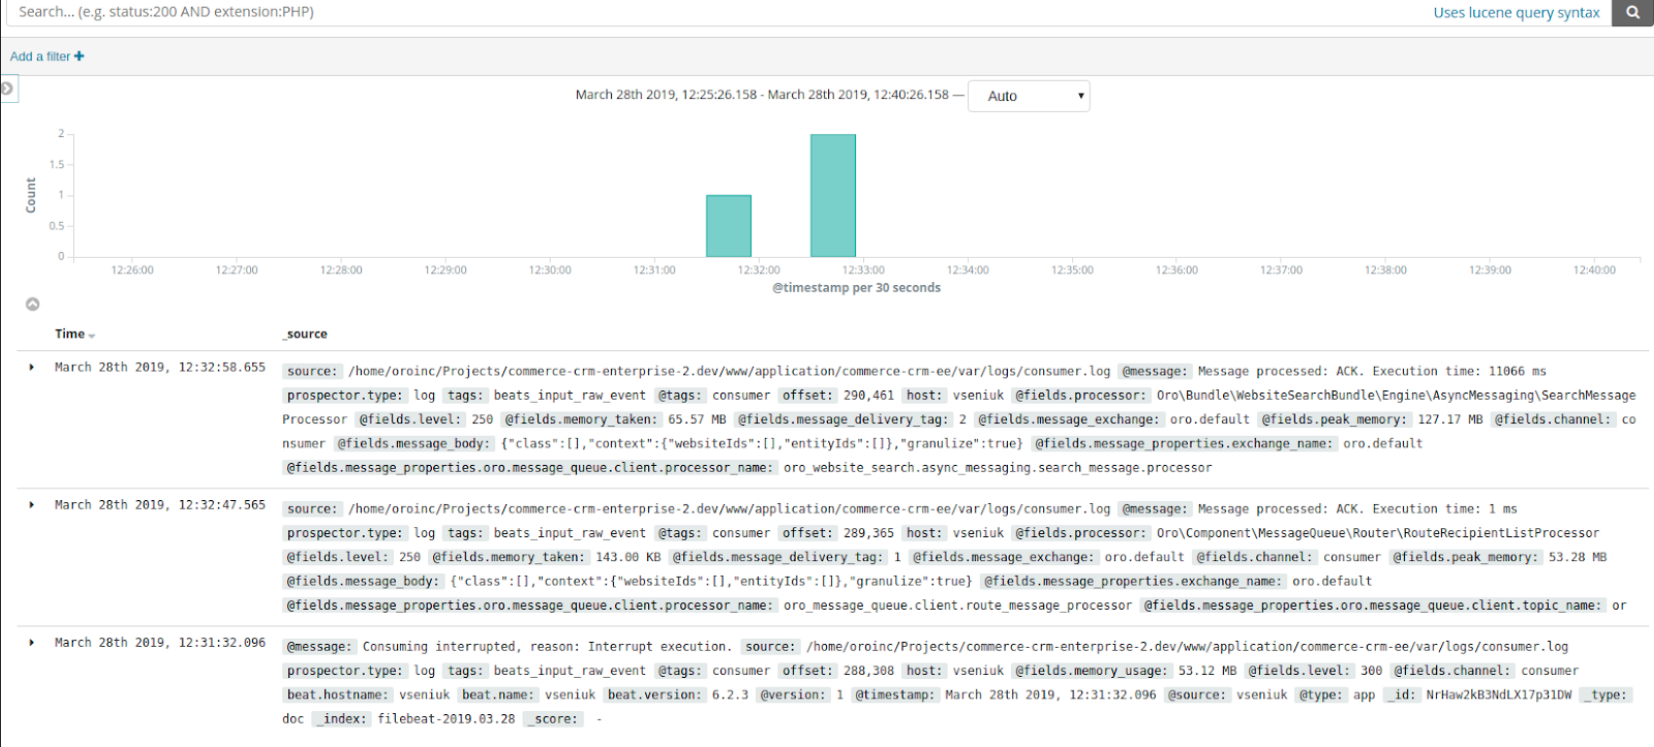
Visualisation
Kibana works in pair with Elasticsearch and gives the possibility to search, view, and interact with data stored in Elasticsearch indices. You can easily perform advanced data analysis and visualize your data in a variety of charts, tables, and maps.
Kibana benefits:
Interactive charts
Mapping support
Pre-built aggregations and filters
Easily Accessible dashboards
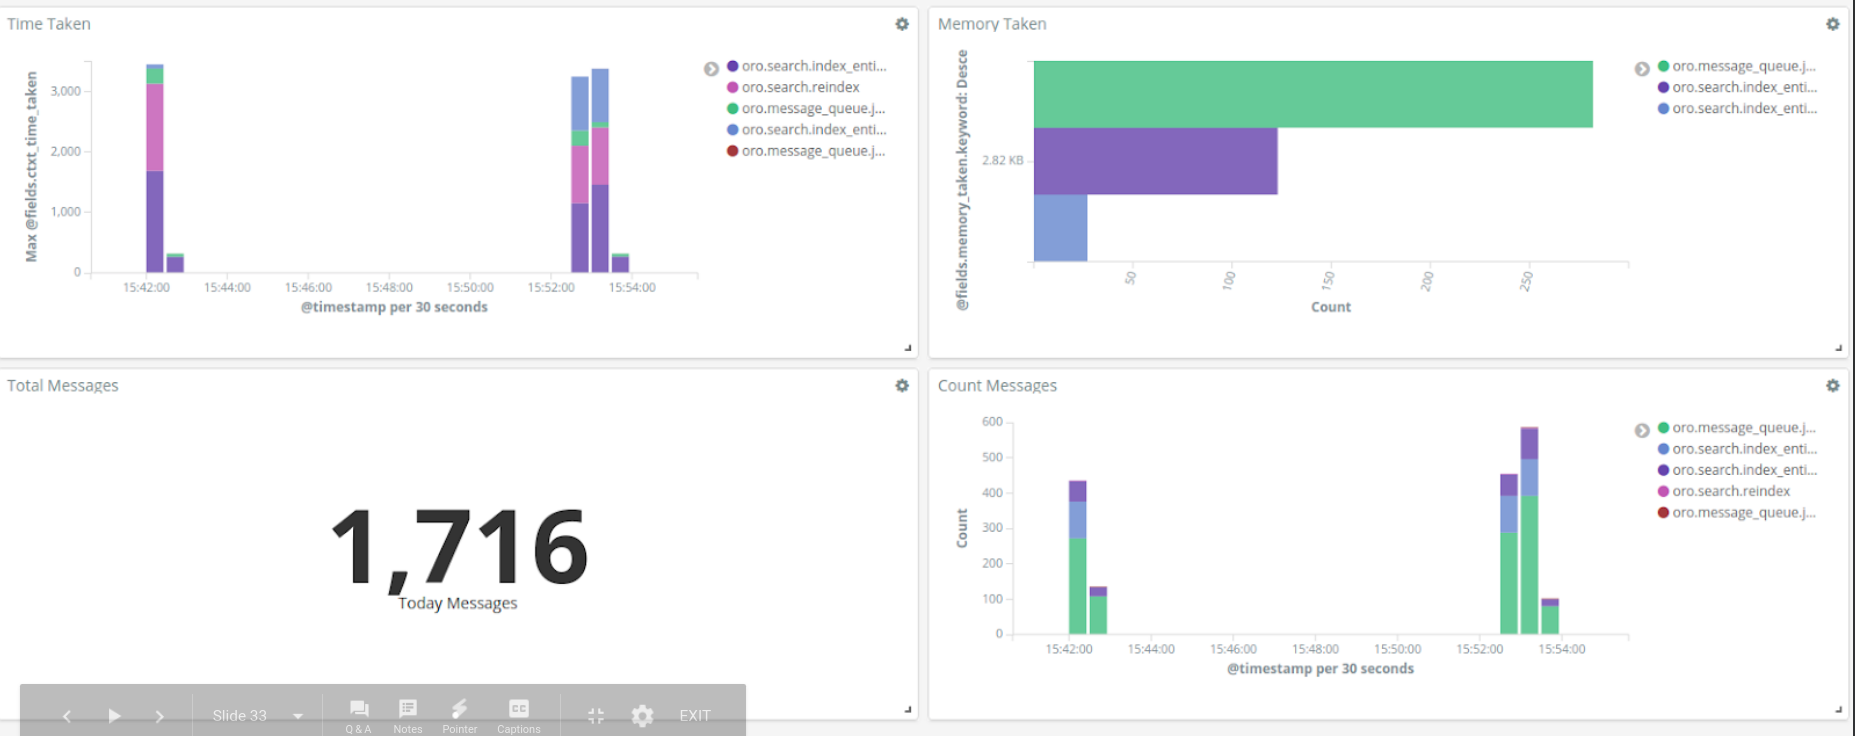
Dashboard
You can easily set up dashboards and reports and share them with others. All you need is a browser to view and explore the data.
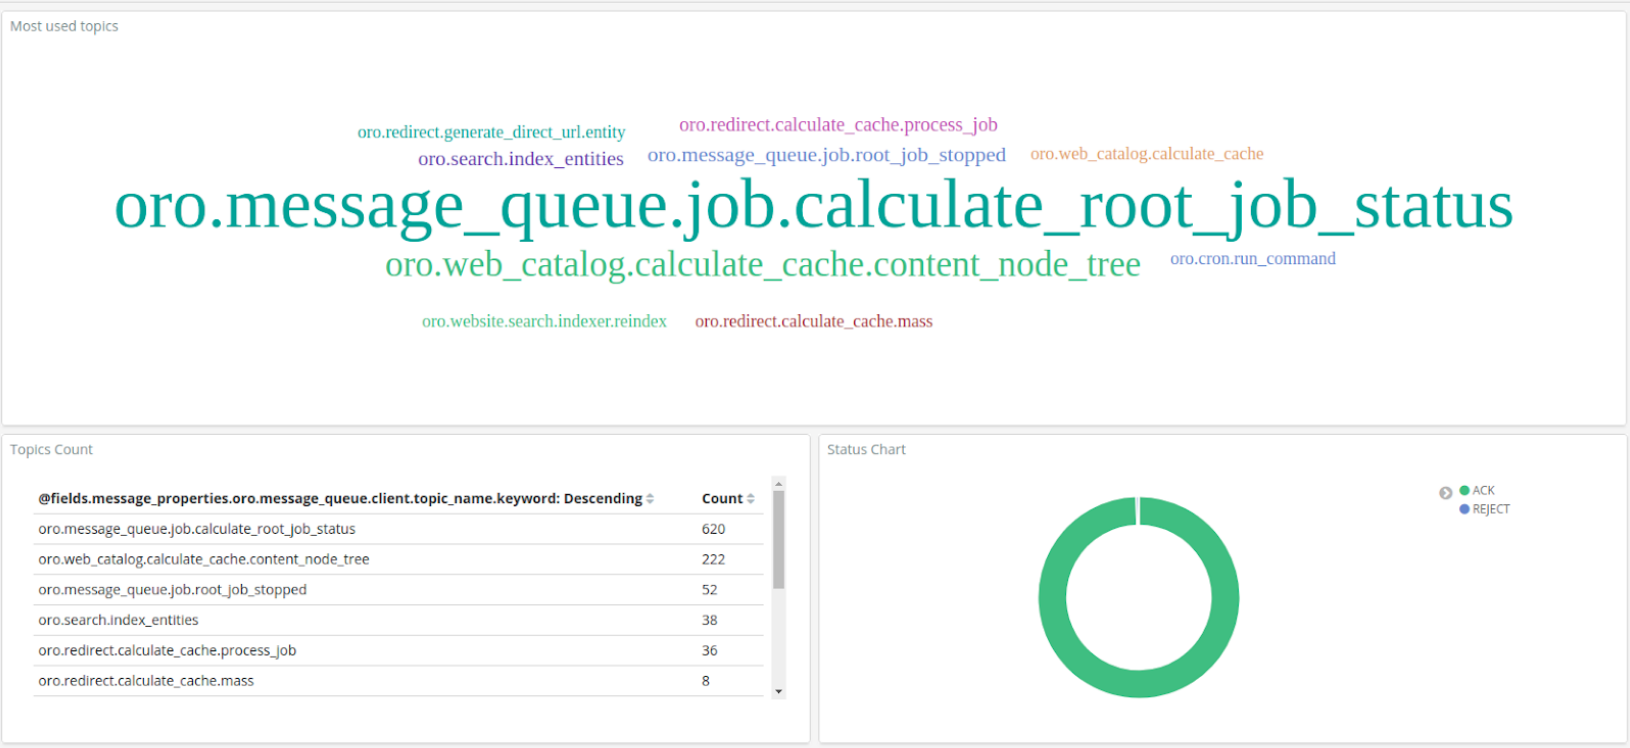
Charts and Metrics
Using Kibana’s pre-built aggregations and filters, you can run a variety of analytics like histograms, top-N queries, and trends with just a few clicks.
For more information, see the following external resources:
Business Tip
Manufacturing companies increasingly embrace digital trends. Here’s how digital transformation in manufacturing industry is possible with eCommerce.