Important
You are browsing upcoming documentation for version 7.1 of OroCommerce, scheduled for release in 2027. Read the documentation for the latest LTS version to get up-to-date information.
See our Release Process documentation for more information on the currently supported and upcoming releases.
Writing Logs to Stackdriver
Google Stackdriver logging allows you to store, search, analyze, monitor, and alert on log data.
Logs can be streamed to the Stackdriver with Logging Agent or manually using GCloud SDK.
A simple example of how you can stream your message queue logs to the Stackdriver with custom Monolog Handler is described below.
Add Google Cloud SDK package:
COMPOSER=dev.json composer require "google/cloud":"~0.70"
Create StackdriverHandler that uses GCloud SDK:
 namespace Acme\Bundle\DemoBundle\Log\Handler;

 use Google\Cloud\Logging\LoggingClient;
 use Monolog\Handler\PsrHandler;
 use Monolog\Logger;

 class StackdriverHandler extends PsrHandler
 {
     /**
      * StackdriverHandler constructor.
      */
     public function __construct()
     {
         $client = new LoggingClient([
             'projectId' => 'Your Project Id',
         ]);

         $logger = $client->psrLogger('oro_message_queue');

         // In current example logs with level Logger::NOTICE and higher will be streamed to the Stackdriver
         parent::__construct($logger, Logger::NOTICE);
     }

     #[\Override]
     public function handle(array $record)
     {
         $record['context']['extra'] = $record['extra'];

         return parent::handle($record);
     }
 }
Define the service in the DI:
 services:
     acme_demo.log.handler.stackdriver:
         class: Acme\Bundle\DemoBundle\Log\Handler\StackdriverHandler
Configure Monolog handler to listen only to message queue logs:
 monolog:
     handlers:
         message_queue.consumer.stackdriver:
             type: service
             id: acme_demo.log.handler.stackdriver
             channels: ['!mq_job_transitive']
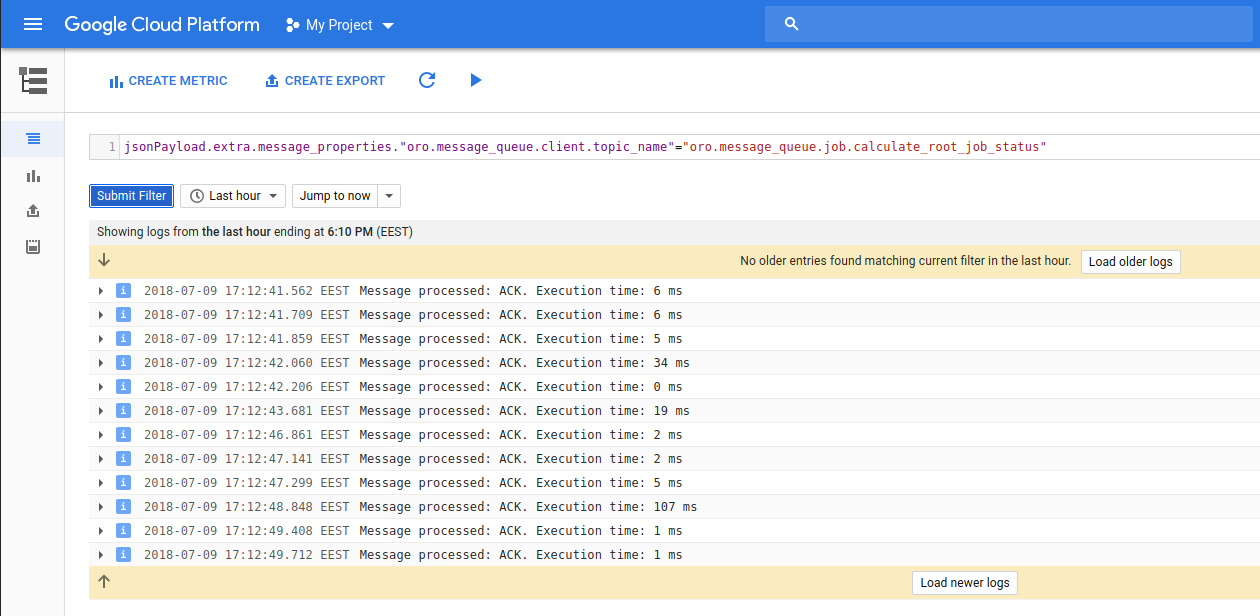
Check the Google Cloud Platform > Stackdriver > Logging > Logs, now you can configure filters and monitor all logs streamed to the Stackdriver.
Logs-Based Metrics
Logs-based metrics is a useful tool to check whats is going on with message consuming. More information is available in the Overview of logs-based metrics topic.
Few examples of logs-based metrics are listed below:
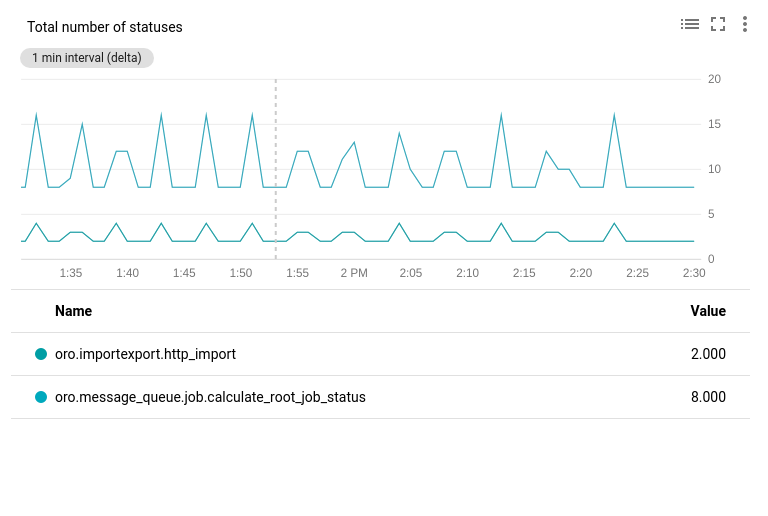
The total number of statuses received.
Check How to Create Counter Metric.
In the viewer panel, create a filter
jsonPayload.status=("REJECT" OR "REQUEUE" OR "ACK"); it shows only the message processed log entriesIn the Metric Editor panel, set the following fields:
Field
Value
Name Add Label Add Label Type
status_count Name: topic, Label type: String, Field name: jsonPayload.extra.message_properties.”oro.message_queue.client.topic_name” Name: status, Label type: String, Field name: jsonPayload.status Counter
The current metrics shows total number of all statuses grouped by Topic Name with Status.
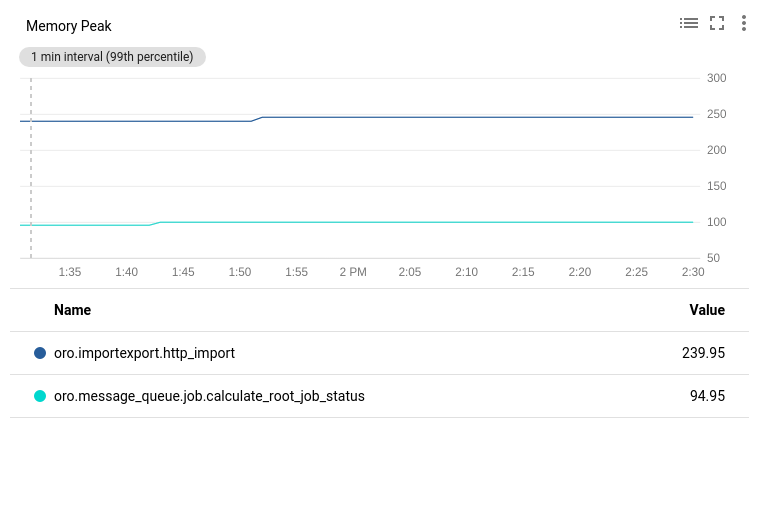
Memory peak of received messages.
In the viewer panel, create a filter
jsonPayload.status=("REJECT" OR "REQUEUE" OR "ACK")it shows only the message processed log entriesIn the Metric Editor panel, set the following fields:
Field
Value
Name Add Label Add Label Type Field name Extraction regular expression Histogram buckets Type Start value Number of buckets Bucket width
peak_memory Name: topic, Label type: String, Field name: jsonPayload.extra.message_properties.”oro.message_queue.client.topic_name” Name: status, Label type: String, Field name: jsonPayload.status Distribution jsonPayload.extra.peak_memory ([0-9.]+) MB Linear (setup current and below values by yours preferences) 40 200 5
The current metrics shows Peak of Memory for each message grouped by Topic Name with Status.
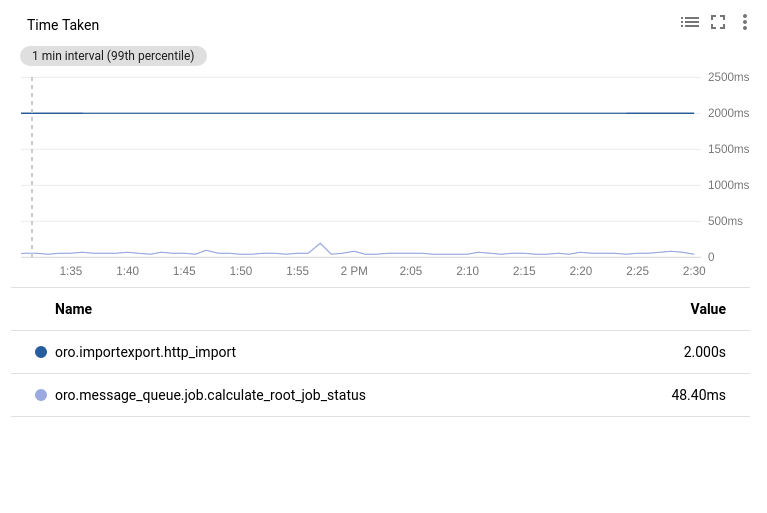
Time taken of received messages.
In the viewer panel, create a filter
jsonPayload.status=("REJECT" OR "REQUEUE" OR "ACK")it shows only the message processed log entriesIn the Metric Editor panel, set the following fields:
Field
Value
Name Add Label Add Label Units Type Field name Histogram buckets Type Start value Number of buckets Bucket width
time_taken Name: topic, Label type: String, Field name: jsonPayload.extra.message_properties.”oro.message_queue.client.topic_name” Name: status, Label type: String, Field name: jsonPayload.status ms Distribution jsonPayload.time_taken Linear (setup current and below values by yours preferences) 5 200 10
The current metrics shows total processing time for each message grouped by Topic Name with Status.
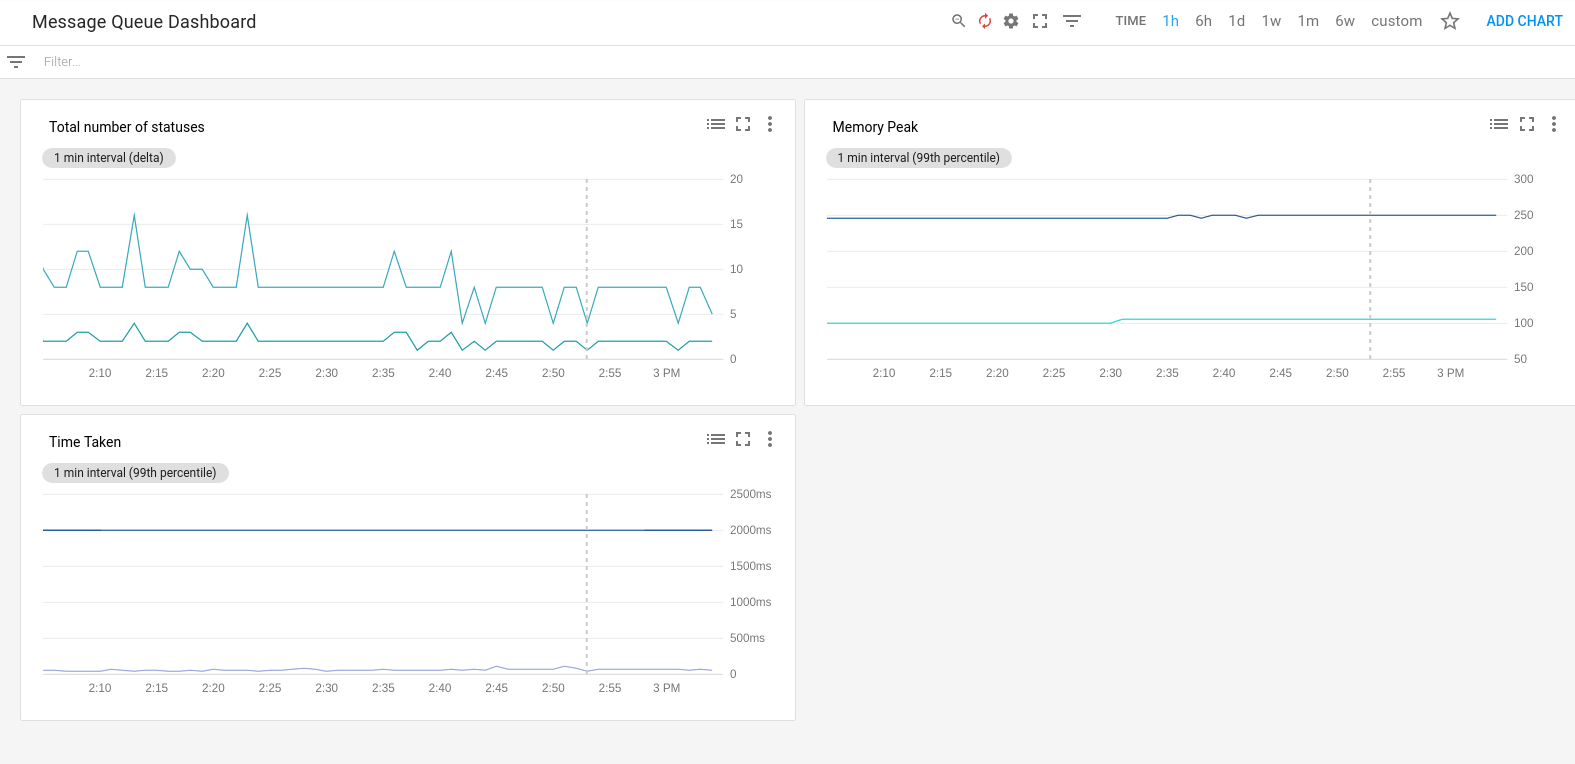
Message Queue Dashboard
Configure “Message Queue Dashboard”, as described in Creating and Managing Dashboard Widgets, and create charts and alerts. You can monitor and be notified if something is not going as expected.