Important
You are browsing the documentation for version 4.1 of OroCommerce, OroCRM and OroPlatform, which is no longer maintained. Read the latest LTS version of the Oro documentation to get up-to-date information.
See our Release Process documentation for more information on the currently supported and upcoming releases.
Reports in Use
This section contains several examples of the report configuration.
Aggregate Data in the Report
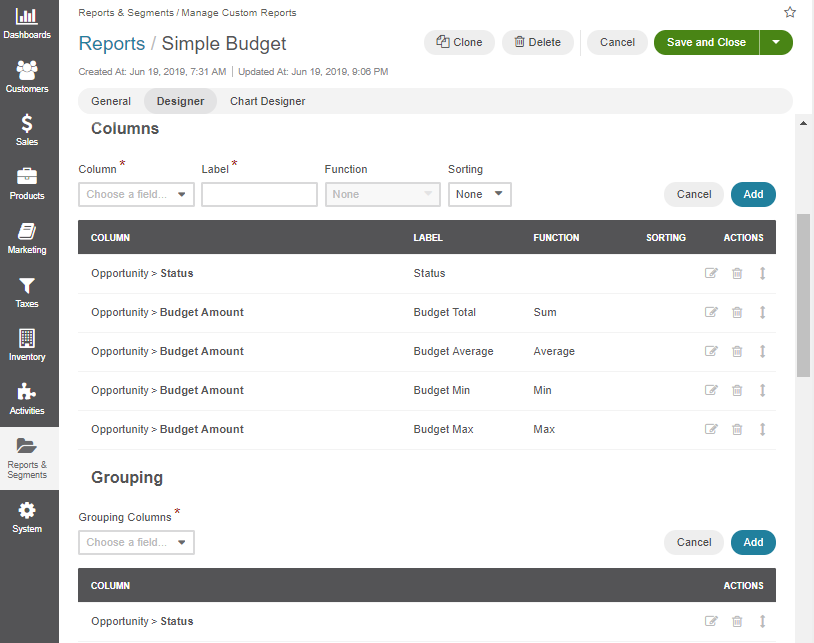
Below is an example of a simple report that displays a particular budget per opportunity.
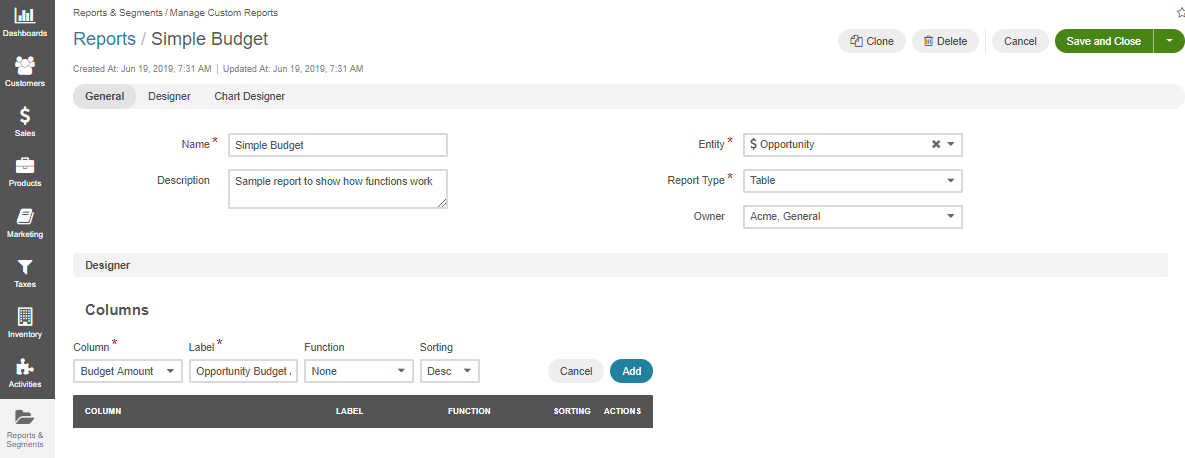
Once you set up the Budget amount column, click Add to add it into the Columns list.
Click Save.
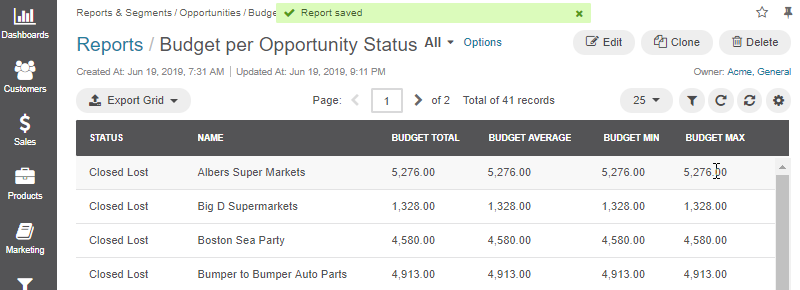
You are now redirected to the report view that shows the opportunities with the known Budget Amount:
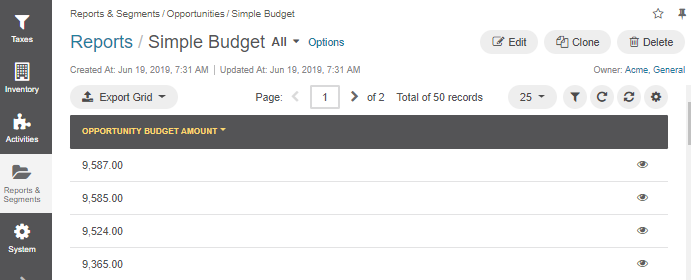
Click Edit to continue the report configuration.
Let us see what happens after we use the Count function for the Opportunity Budget column:
Click to update the column and change the function for the Budget amount to Count.
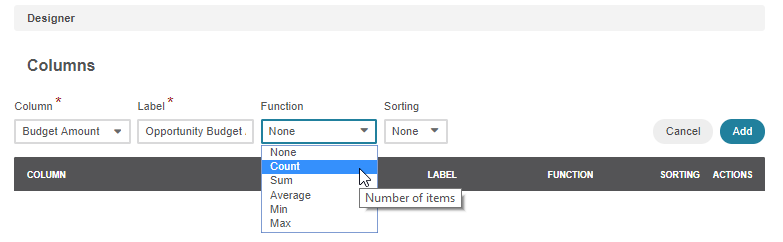
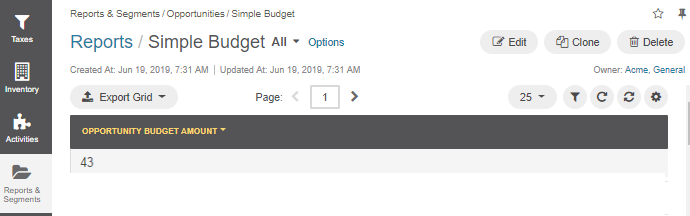
Click Save. The report data changes:
Report Preview (Function = Count)
Similarly, you can use sum, max, average, and min functions.
Report Preview (Function = Sum)
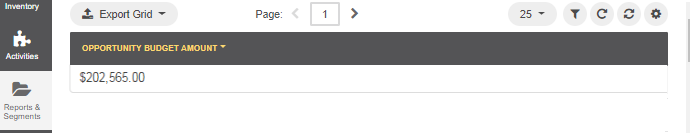
The sum of Budget Amount values of all opportunities makes $202,565.00.
Report Preview (Function = Max)
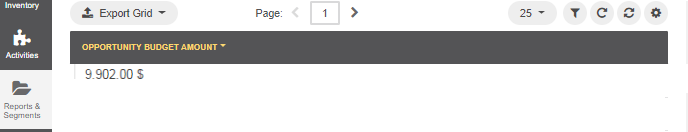
The biggest budget amount value of the opportunity is $9,902.00.
Use Simple Grouping by Value
You can group the information in the report by unique values in the column(s).
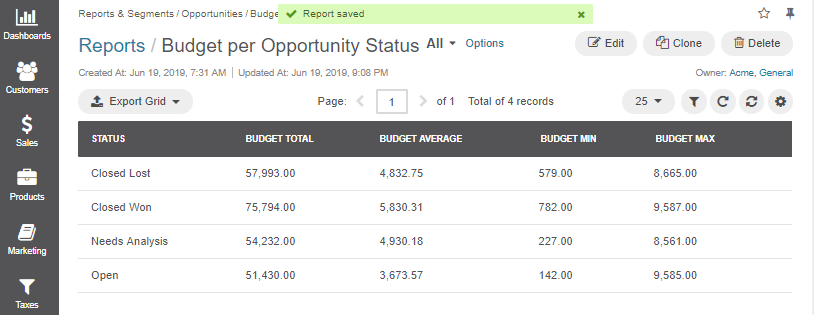
The report preview:
Use Grouping by Value at Multiple Levels
You can group records based on several columns (e.g., per opportunity status and the business customer name).
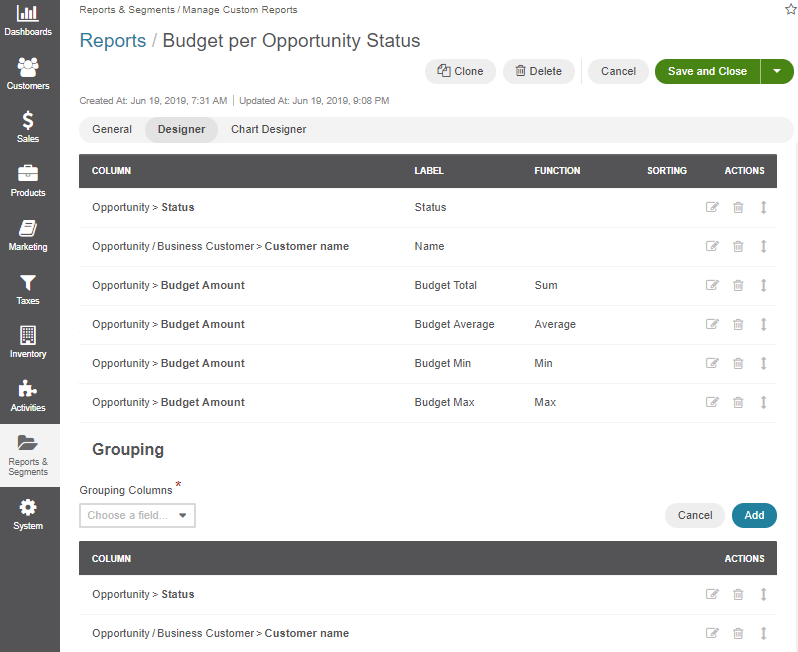
Now, you can see the calculated budget metrics (total, average, min, and max) for all the opportunities with the same status that belong to a specific customer.
The report preview:
Hint
Once a report is generated, you can click the name of a column to sort all the data in the report by the specified field value (ascending or descending).
Here is an example of the report ordered by the Name column:
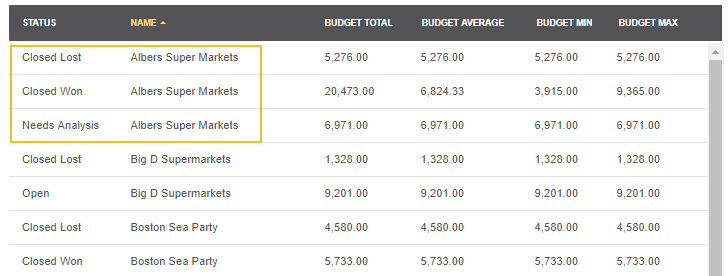
As you can see in the outlined area, there are opportunities which are won, lost and requires analysis for Albers Super Markets. You can view the budget details for the all those groups.
Note
If the customer’s name is the most important part of the grouping, it might be reasonable to edit the report and move the column to make it first.
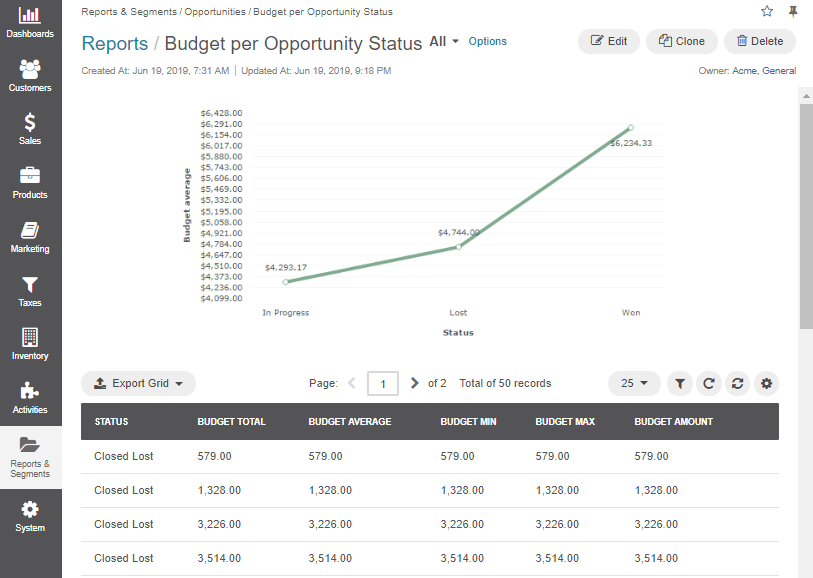
Use Charts
Let us make a chart for the budget per opportunity status report (not grouped by customers).
Configuration:
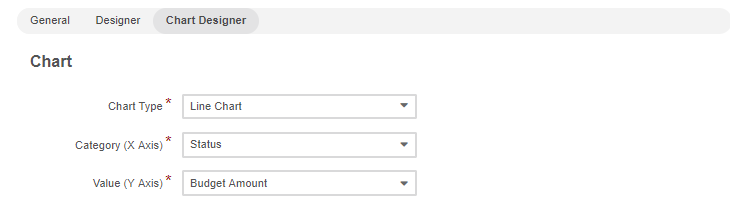
Output:
Related Topics