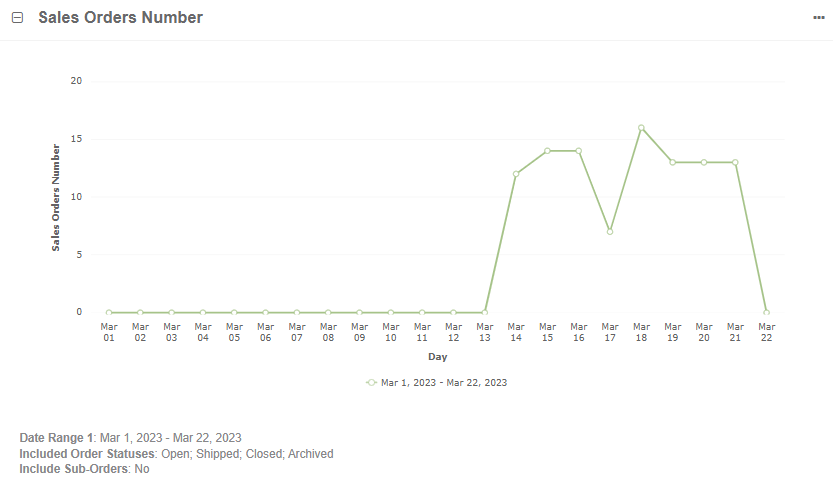
Sales Orders Number
This widget displays a configurable line chart based on the number (count) of orders for the selected period of time to easily assess the sales order number over a period of time, and to compare sales order number over multiple periods of time if needed.
Note
For how to add widgets to the dashboard and manage them, see the relevant topics:
Sales Orders Number Widget Configuration
You can adjust the following settings for the widget:
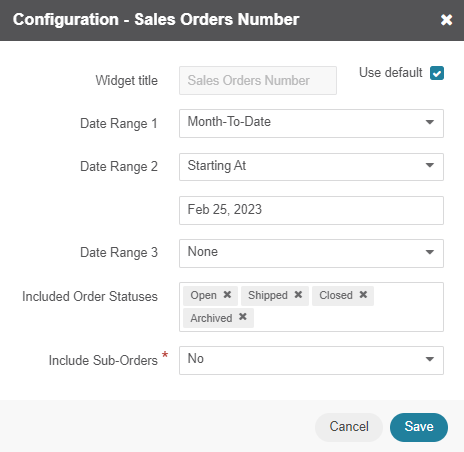
Widget title — the name displayed on the dashboard. To change the name, clear the Use Default checkbox and provide a new name.
Date Range 1 — the time period for the widget details to be displayed. You can set the period per today, month-to-date, quarter-to-date, year-to-date, or all time up to the current day. You can also customize the time period as required. This period is represented on the x-axis and is used as a basis for Date Range 2 and 3, if configured.
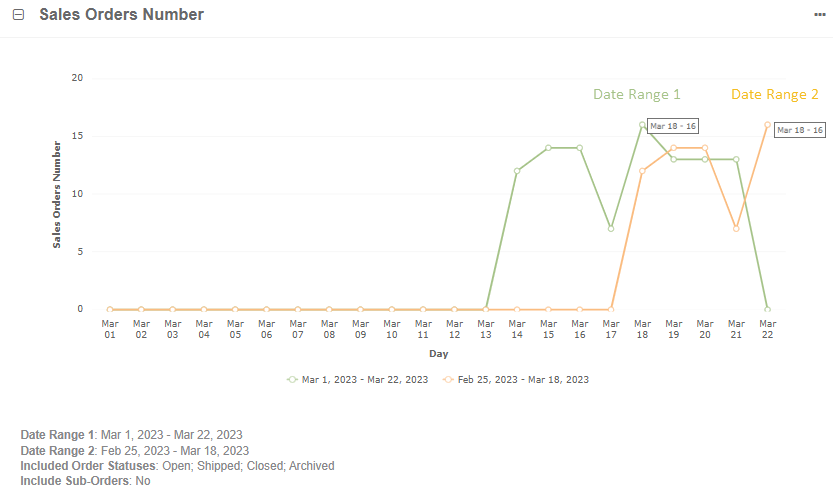
Date Range 2 — the second time period that displays the sales order number over the selected period. To choose the date range, select the Starting At option in the drop-down and set the date to start the range. The chart uses the x-axis of Date Range 1 to illustrate its own period. Remember, that you specify only their starting date, while their end date is determined automatically by the duration of Date Range 1.
For example, Date Range 1 is set to Month-To-Date, Starting At date of Date Range 2 is set to February 1. If today is March 9, then Date Range 1 is rendered from March 1 to March 9 (i.e., nine days), and Date Range 2 - from February 1 to February 9 (nine days). If today is March 22, and Date Range 2 starts on February 25, then Date Range 1 is represented from March 1 to March 22, and Date Range 2 - from February 25 to March 18 (22 days). To see the order number details, hover over the required data point on the chart.
Date Range 3 — the third time period that displays the sales order number over the selected period. To choose the date range, select the Starting At option in the drop-down and set the date to start the range. The chart uses the x-axis of Date Range 1 to illustrate its own period. Remember, that you specify only their starting date, while their end date is determined automatically by the duration of Date Range 1. To see the order number details, hover over the required data point on the chart.
Included Order Statuses — select all order statuses to be considered when calculating sales order number.
Include Sub-Orders — select whether to include sub-orders when calculating sales order number.