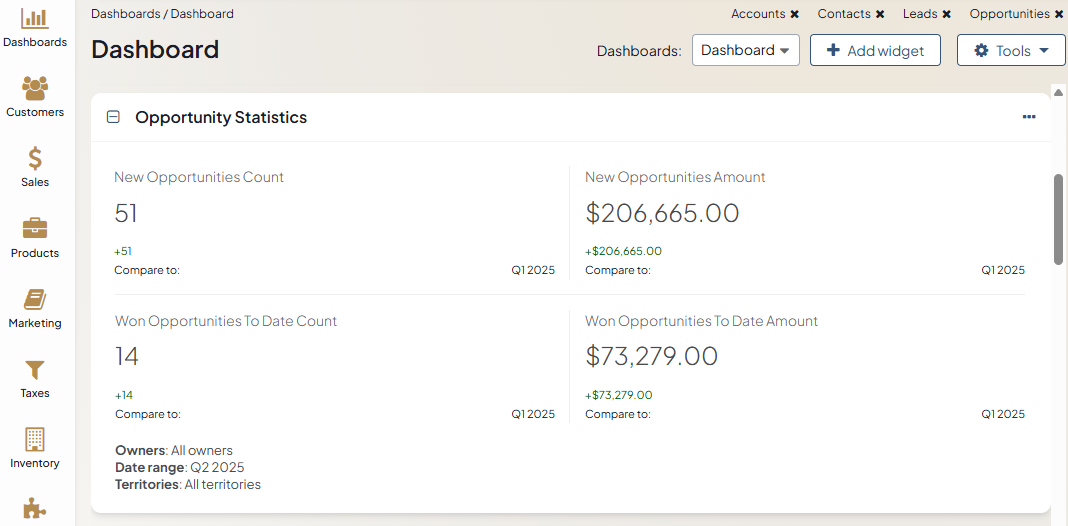
Opportunity Statistics
The Opportunity Statistics widget displays a set of metrics that indicate the performance of the opportunity pipeline.
Note
For how to add widgets to the dashboard and manage them, see the relevant topics:
Opportunity Statistics Configuration
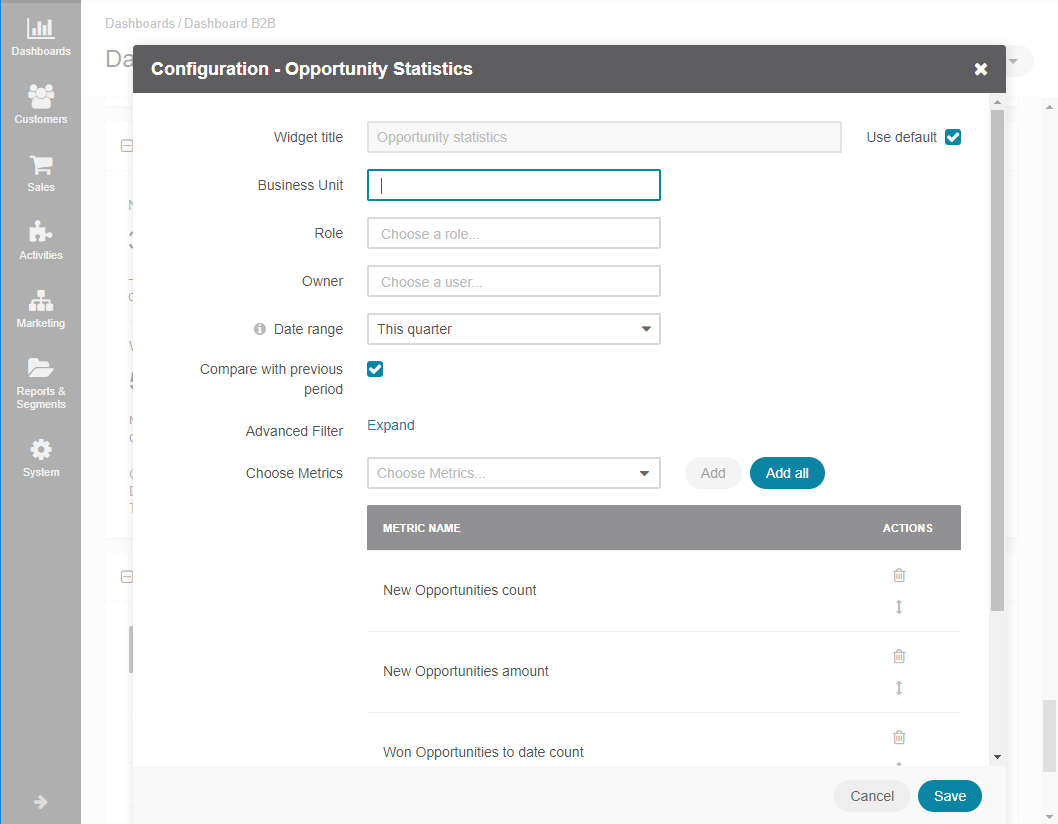
You can adjust the following settings for the opportunity statistics widget:
Widget title — the name displayed on the dashboard. To change the name, clear the Use Default checkbox and provide a new name.
Business unit — select the business unit to present statistics for.
Role — select the user’s role (e.g., a sales manager, an administrator, a leads development rep, etc.) to see statistics for.
Owner — select the owner for the widget to see statistics for a particular user.
Date range — time for which the widget details are displayed.
Compare with previous period — tick this option if you wish to compare statistics for the current and the previous periods and see it displayed in the dashboard widget.
Advanced Filter — set the conditions if you wish to filter your opportunities.
Choose Metrics — select what data the widget will display:
New Opportunities count
New Opportunities amount
Won Opportunities to date
Won Opportunities to date amount
Territories — if sales territory are enabled in your system, you can view opportunities filtered within one or several specific territories.